
Memory is the best evidence, although the hardest to preserve. If you recall Frozen II “Water has memory”. The same is with this. Even if you delete all the evidence, memory is silently remembering all that. But it’s so fragile….

There are sevaral data types that can hold volatile data i.e. data about some state of RAM in time. Not all of them exist on every system:
- RAM image. Can be aquired for all PC, there are certain complications with a Mac. Also, for mobile devices you can collect RAM data for separate processes only. For virtual machines are usually stored in a separate file once the system is suspended.
- Hibernation files. Exist on major OS (Windows, Mac, Linux). For Windows - hyberfil.sys. It’s a RAM capture made by OS itself when the PC is falling asleep 💤.
- Page files.
- Swap files.
- Crash dumps.
In general, things we are going to do are specific to the case type. It case of a malware infection we will be looking for rogue processes, rootkits and other such things, while in child exploitation or insider threat - these are not top priority. In case of child exploitation we would be more interested in some png or jpeg still residing somewhere in memory.
Why collect RAM?
- User Activity –> File usage and knowledge. Proove someone did something or used something. Common artifacts: Prefetch, Shimcache, Web browser, $MFT (master file table).
- Encryption –> Key files and passwords. Common tools: hashcat, passware.
- Host compromise –> Processes, network activity, malware, rootkits, persistence.
Hibernation files store the last state of RAM before “falling asleep” 💤 . These files are of a particular value when live acquisition is impossible.
🛠 Belkasoft RAM Capturer. ~4Mb footprint in RAM, slow. Magnet RAM Capturer - huge footprint, fast. Dumpit - the fastest, the smallest footprint (didn’t work on Win10 on a VM Parallels on macOS). All of the aforementioned tools run in kernel mode! FTK Imager - big footprint, user mode, doesn’t work on VM (in my case). Benchmark the tools yourself from time to time. Redline, Fast Dump (fdpro.exe). Sumuri’s Interception (included with Paladin). Exploits some memory bug on some OS for machines that have either Thunderbolt or a Firewire to overwrite the admin’s password in memory.
Malfind. https://www.linkedin.com/pulse/process-injection-detection-malfind-britton-manahan/
Windows
Get the Profile Info (vol2)
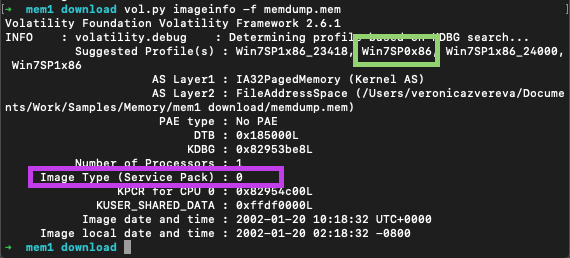
Purple square - Service pack. Green - correct profile with the correct service pack.
vol.py -f hiberfil.sys --profile=Win7SP0x86 imagecopy -O hyber.raw
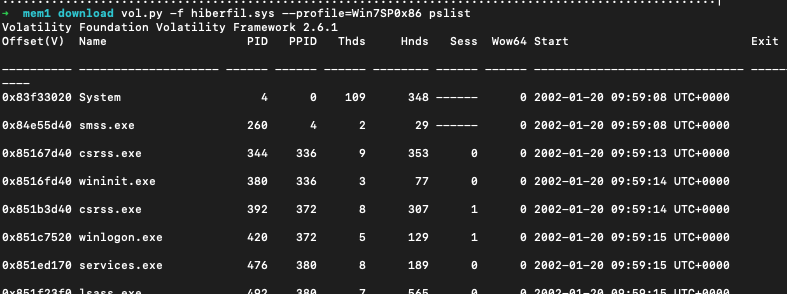
Then validate the file by listing processes that were run:
vol.py -f hiberfil.raw pslist --profile=Win7SP0x86
Size up to 75% of memory size.
imagecopy plugin is used to convert some file type into .raw. It decreases the time, needed to analyse the file.
Convert to raw mem
hiberfil files are not as common, but just as good. imagecopy plugin converts different formats into raw format to speed up. Also saves up to 75% of memory size, therefore decreases the time for analysis. First, determine the OS profile (for vol2) and run the plugin. Example:
vol.py -f hiberfil.sys --profile=Win7SP0x86 imagecopy -O hyber.raw
How to get the correct profile since imageinfo gives you several options and kdbscan gives even more? Below is the output from imageinfo. Purple square shows service pack version and the green one - the correct profile with the correct service pack. Other two suggested profiles have some service packs versions appened to the end.
vol.py -f crash.dmp --profile=Win7SP2x64 imagecopy -O crash2mem.raw
vol.py -f hyberfil.sys --profile=Win7SP2x64 imagecopy -O hibir2mem.raw
Running vol.py imageinfo -f hiberfil.sys, for example, is slow and inefficient. No profiles were sugested. But when we have a live capture of a system, we can use this dump to determine the profile to perfom actions with the right profile on hyberfil.sys.
Triage of Windows Core Processes
Deviations = investigative leads. Core Processes - essential for Win, run on any Win system under examination.

- check names
- parent (for example, svchost.exe is started by services.exe)
- expected path
- Singleton?
- Account (local system, mane, users)
- start time (boot time, later)
svchost.exe - the most abused process. Check for above deviations in the result.
Check parent processes of core processes:
grep -E -i "(system|wininit|lsass|lsm|services|sms|taskhost|winlogon|iexplore|explorer|svchost|csrss)" pslist.txt > pslist-all-core.txt

grep -E -i "(system|wininit|lsass|lsm|services|sms|taskhost|winlogon|iexplore|explorer|svchost|csrss)" psscan.txt > psscan-all-core.txt
Check names of non-win processes:
grep -E -i -v "(system|wininit|lsass|lsm|services|sms|taskhost|winlogon|iexplore|explorer|svchost|csrss)"  pslist.txt > pslist-all-non-wincore.txt

grep -E -i -v "(system|wininit|lsass|lsm|services|sms|taskhost|winlogon|iexplore|explorer|svchost|csrss)"  psscan.txt > psscan-all-non-wincore.txt
Check known singletons
grep -E -i "(system|wininit|lsass|services|lsm)" pslist.txt > pslist-all-singletons.txt

grep -E -i "(system|wininit|lsass|services|lsm)" psscan.txt > psscan-all-singletons.txt

In the example above there are two lsass.exe processes which is nonsence. Obviously, some investigative lead.
Check bootimes:
grep -E -i "(system|wininit|lsass|services|sms|lsm|csrss)" pslist.txt > pslist-all-boot.txt

grep -E -i "(system|wininit|lsass|services|sms|lsm|csrss)" psscan.txt > psscan-all-boot.txt
System is a pivot point. Other processes that should start at boot, should have approximately the same starting date and time.
pslist is pulling the information of a doubly-linked list (like a Task Manager). psscan - unallocated space (processes terminated or unlinked from this double-linked list).
Analysis Example
We have the result of pslist:

We have several suspicious processes here: scvhost.exe (misspelled svchost.exe), some xminer.exe and a process with an intriguing name 3.exe. But these are the processes that we could have seen, should we use a Task Manager on a live system. What about terminated or unlinked processes?
To answer that we run psscan:

We seen the same 3.exe in the list. But also we see q.exe which was run for about a minute and during that time another processes was spawned - xmcminer.exe. q.exe was terminated that’s why we don’t see it in pslist results. But xmcminer.exe was not terminated but we still don’t see it in pslist. That means that the process was unlinked from double-list of processes in memory (aka hidden).
Take unique process names, sort and count:
cut -d " " -f 2 'psscan.txt' | sort | uniq -c | sort > 'psscan_proc_sorted.txt'
Also, get all processes that did not start at boot time:
grep -E -i -v 2019-01-20 'pslist.txt' > pslist_not_boottime.txt

grep -E -i -v 2019-01-20 'psscan.txt' > psscan_not_boottime.txt
macOS
SIP?
Linux
Swap space
Mobile
For mobile platforms (iOS and Android) there is currently no tool available to get a full copy of RAM. However, it’s still possible to take memory space of each process running.
💡 Research 🔬 Top secret yet
To get the list of running processes:
To get the memory space of a process:
frida-dump # had some bug for iOS, py file might need manual pathing.
clutch
objection
References
References
[1] Тайны файла подкачки pagefile.sys: полезные артефакты для компьютерного криминалиста
[2] About hybernation files
[3] About new hybernation file format