
Event Logs in Windows provide valuable insights for defenders. They can be forwarded to a central machine to monitor organisational-level activities and detect malicious behaviour effectively.
Anatomy
There are several major log trails: Application (individual apps activity), Security (logins and logouts etc.), System (OS derived), Custom (lots of them, for example, PowerShell logs) and Forwarded (from remote). All of them are files with evt (WinXP, Windows 2003) or evtx (Vista +) extensions.
📂 Path: %SystemRoot%\System32\config (old Windows)
📂 Path: %SystemRoot%\System32\winevt\logs (newer Windows) + remote logs
IIS logs are by default here: 📂 C:\%System%\System32\LogFiles\W3SVC1.
\Windows\System32\winevt\logs\*.evtx
\Windows\System32\SRU\srudb.dat
\Windows\inf\setupapi.dev.log
\Users\%username%\AppData\Local\ConnectedDevicesPlatform\*\ActivitiesCache.db
⛔️ Default location can be changed via the following keys 🔑 :
HKLM\SYSTEM\CurrentControlSet\Services\EventLog\Application,HKLM\SYSTEM\CurrentControlSet\Services\EventLog\SystemandHKLM\SYSTEM\CurrentControlSet\Services\EventLog\Security(for each corresponding log trail).
⛔️ These are binary files implemented as circular loops (call it Queue), meaning that the oldest entry will be overwritten the first. The logs are overwritten or archived depending on the settings, or the system raises an exception when running out of disk space.
⛔️ Now it’s only updated by LSASS. Third-party apps can’t write the logs.
Each event contains the following information:
- Log Name (aka a trail)
- Source (which application is complaining)
- ID - unique identifier for this event type. Meaning there will be a lot of events with the same Event ID.
- EventRecord ID - unique identifier for this event. Meaning for each log entry, this value will be different.
- Task Category - what is this event for?
- Level - no worries (🏝️), be careful (🤔) or hell, my pants are on fire (😨), you catch the drift.
- Keywords - aka a tag, to help categorise an event.
- User - user account responsible for this.🛠️
- OpCode - Identify the specific operation that the event reports.
- Timestamp when the event was logged.
- Computer - the name of a machine responsible for this.
- XML data - holds all the items from 1 to 10 and some more.
📚 Further Reading: https://learn.microsoft.com/en-US/windows/security/threat-protection/
❗️If you don’t see some event ids that you are supposed to, then try turning on all auditing policies using
secpol.mscor going toStart -> Windows Administrative Tools -> Local Security Policy. In the opened window then go toLocal Policiesand chooseAudit Policy. Either turn on each of them or turn on the ones that you think are responsible I was able to start capturing event 5156. I was using Vbox with Windows Server 2019 installed, and the machine was promoted to DC (Active Directory Feature installed).
❗️ Most relevant events are recorded on the target system, but some are also present in the source system. We must combine those two to have a bigger picture, especially spotting lateral movement. Some events logged on the SOURCE system are Security
4648, Security4776(👴🏼680) andMicrosoft-Windows-TerminalServiceRDPClienttrail.
Security
It’s the most important trail. It records the following event types: account logon (whoever authorised logon), management, directory service (attempted access to AD objects), logon events (on a local system), object access, policy change, privilege user, process tracking, system events (start, shutdown, actions affecting this trail).
🛠️ Tools
Event Viewer
❓How could an attacker delete entries from the Event Viewer and what level of access would they need?
To configure what’s being logged and what’s ignored, set up the appropriate policies here -secpol.msc. Config example:
- Audit account logon events - success + failure
- Audit account management - success + failure
- Audit logon events - success + failure
- Audit object access - failure (too many successes will be generated)
- Audit privileged use - success + failure
- Audit system events - success + failure
This might chew up lots of disk space, so be careful. I might try this config to look for network events, I could not see before.
You can create a custom filter to pivot around some event. For example, filter for 4624 events. One can do it both in the UI menu or provide an XML query (📚 read more here).
Event Log Explorer
Has a free version for non-commercial use. Allow creating lots of filters and has a GUI.
Evtxecmd
Eric Zimmerman’s Evtxecmd tool. Console tool that can export the result in a csv file. This csv can then be loaded into TimeLine explorer for further analysis.
Chainsaw
Is a CUI tool that has some predefined rules to search for interesting events. Can digest a lot of event logs at a time and produce a single output. For a usage example refer to the Blog section (Cybercorp1, calendar 📅 Jan 2022).
Kansa
.\Modules\Log\Get-LogWinEvent.ps1 security | Out-GridView
PSLogList
SysInternals
F-Response
Access to raw data on disk.
Kape
Velociraptor
Powershell
📘 Get-WinEvent -LogName Security
📘 (Get-WmiObject -Class Win32_NTEventLogFile | Where-Object LogFileName -eq 'System').BackupEventLog("output\path")
📘 Get-WinEvent -ComputerName blah # remote
📘 Get-WinEvent -LogName blah # local
📘 Get-WinEvent -Path blah # archive
Sysmon
📑 Microsoft-Windows-Sysmon/Operational ( has prefiltering)
1 - mof compiled, 20 - Consumer added
Sysmon includes the following capabilities:
- Logs process creation with full command line for both current and parent processes.
- Records the hash of process image files using SHA1 (the default), MD5, SHA256 or IMPHASH.
- Multiple hashes can be used at the same time.
- Includes a process GUID in process create events to allow for correlation of events even when Windows reuses process IDs.
- Includes a session GUID in each event to allow correlation of events on same logon session.
- Logs loading of drivers or DLLs with their signatures and hashes.
- Logs opens for raw read access of disks and volumes.
- Optionally logs network connections, including each connection’s source process, IP addresses, port numbers, hostnames and port names.
- Detects changes in file creation time to understand when a file was really created. Modification of file create timestamps is a technique commonly used by malware to cover its tracks.
- Automatically reload configuration if changed in the registry.
- Rule filtering to include or exclude certain events dynamically.
- Generates events from early in the boot process to capture activity made by even sophisticated kernel-mode malware.
Log IDs 1-24 + 225.
https://www.ultimatewindowssecurity.com/securitylog/encyclopedia/
System Logs.
Security Logs.
Application Logs. Not generally useful for IR.
Codes
TerminalServicesRDPClient
❗️ Records activity on the SOURCE system
Event ID 21: Remote Desktop Services: Session logon succeeded.
Event ID 23: Remote Desktop Services: Session logoff succeeded.
Event ID 24: Remote Desktop Services: Session has been disconnected.
Event ID 25: Remote Desktop Services: Session reconnection succeeded.
Event ID 39: Session X has been disconnected by session Y.
Security
Event ID 4624: This event is generated when a logon session is created (i.e., a user successfully logs on).
Event ID 4625: This event is generated when a logon request fails.
Event ID 4648: This event is generated when a logon is attempted using explicit credentials, which often indicates a user is attempting to run a program as a different user.
Event ID 4672: This event is generated when a user logs on with superuser (or admin) rights.
Event ID 4700-4702: These events are related to scheduled tasks and can indicate when a task is triggered or finished.
Event ID 4720: This event is generated when a user account is created.
Event ID 4728: This event is generated when a user is added to a security-enabled global group.
Event ID 4732: This event is generated when a user is added to a security-enabled local group.
Event ID 4738: This event is generated when a user account is updated.
Event ID 4768: A Kerberos authentication ticket (TGT) was requested.
Event ID 4776: The domain controller attempted to validate the credentials for an account.
Event ID 7045: A service was installed in the system.
7034- Service crashed unexpectedly. 7035 - Service sent a Start/Stop control. 7036 - Service started or stopped. 7040 - Start type changed.
Authentication and Authorisation
When the logon is failing, the following error codes are the most frequently used (NTLM 🗝️ and Kerberos 🐕🦺):
- 🗝️
C0000064(🐕🦺0x6) - the username provided is invalid (doesn’t exist). - 🗝️
C000006A(🐕🦺0x18) - the password provided is invalid. - 🗝️
C0000070(🐕🦺0xC) - unauthorised workstation. - 🗝️
C0000234(🐕🦺0x12) - account is locked. - 🗝️
C0000071(🐕🦺0x17) - the password has expired. - 🐕🦺
0x7- server was not found. - 🐕🦺
0x25- the time difference between the machines is too big.
4907
Audit policy change.
This event generates when the SACL of an object (for example, a registry key or file) was changed.
Windows System Logs
Event ID 1074 (System Shutdown/Restart): This event log indicates when and why the system was shut down or restarted. By monitoring these events, you can determine if there are unexpected shutdowns or restarts, potentially revealing malicious activity such as malware infection or unauthorized user access. Event ID 6005 (The Event log service was started): This event log marks the time when the Event Log Service was started. This is an important record, as it can signify a system boot-up, providing a starting point for investigating system performance or potential security incidents around that period. It can also be used to detect unauthorized system reboots. Event ID 6006 (The Event log service was stopped): This event log signifies the moment when the Event Log Service was stopped. It is typically seen when the system is shutting down. Abnormal or unexpected occurrences of this event could point to intentional service disruption for covering illicit activities. Event ID 6013 (Windows uptime): This event occurs once a day and shows the uptime of the system in seconds. A shorter than expected uptime could mean the system has been rebooted, which could signify a potential intrusion or unauthorized activities on the system. Event ID 7040 (Service status change): This event indicates a change in service startup type, which could be from manual to automatic or vice versa. If a crucial service’s startup type is changed, it could be a sign of system tampering. Windows Security Logs
Event ID 1102 (The audit log was cleared): I’ve already discussed this one, but to reiterate, clearing the audit log is often a sign of an attempt to remove evidence of an intrusion or malicious activity. Event ID 1116 (Antivirus malware detection): This event is particularly important because it logs when Defender detects a malware. A surge in these events could indicate a targeted attack or widespread malware infection. Event ID 1118 (Antivirus remediation activity has started): This event signifies that Defender has begun the process of removing or quarantining detected malware. It’s important to monitor these events to ensure that remediation activities are successful. Event ID 1119 (Antivirus remediation activity has succeeded): This event signifies that the remediation process for detected malware has been successful. Regular monitoring of these events will help ensure that identified threats are effectively neutralized. Event ID 1120 (Antivirus remediation activity has failed): This event is the counterpart to 1119 and indicates that the remediation process has failed. These events should be closely monitored and addressed immediately to ensure threats are effectively neutralized. Event ID 4624 (Successful Logon): This event records successful logon events. This information is vital for establishing normal user behavior. Abnormal behavior, such as logon attempts at odd hours or from different locations, could signify a potential security threat. Event ID 4625 (Failed Logon): This event logs failed logon attempts. Multiple failed logon attempts could signify a brute-force attack in progress. Event ID 4648 (A logon was attempted using explicit credentials): This event is triggered when a user logs on with explicit credentials to run a program. Anomalies in these logon events could indicate lateral movement within a network, which is a common technique used by attackers. Event ID 4656 (A handle to an object was requested): This event is triggered when a handle to an object (like a file, registry key, or process) is requested. This can be a useful event for detecting attempts to access sensitive resources. Event ID 4672 (Special Privileges Assigned to a New Logon): This event is logged whenever an account logs on with super user privileges. Tracking these events helps to ensure that super user privileges are not being abused or used maliciously. Event ID 4698 (A scheduled task was created): This event is triggered when a scheduled task is created. Monitoring this event can help you detect persistence mechanisms, as attackers often use scheduled tasks to maintain access and run malicious code. Event ID 4700 & Event ID 4702 (A scheduled task was enabled/disabled): This records the enabling or disabling of a scheduled task. Scheduled tasks are often manipulated by attackers for persistence or to run malicious code, thus these logs can provide valuable insight into suspicious activities. Event ID 4702 (A scheduled task was updated): Similar to 4698, this event is triggered when a scheduled task is updated. Monitoring these updates can help detect changes that may signify malicious intent. Event ID 4719 (System audit policy was changed): This event records changes to the audit policy on a computer. It could be a sign that someone is trying to cover their tracks by turning off auditing or changing what events get audited. Event ID 4738 (A user account was changed): This event records any changes made to user accounts, including changes to privileges, group memberships, and account settings. Unexpected account changes can be a sign of account takeover or insider threats. Event ID 4771 (Kerberos pre-authentication failed): This event is similar to 4625 (failed logon) but specifically for Kerberos authentication. An unusual amount of these logs could indicate an attacker attempting to brute force your Kerberos service. Event ID 4776 (The domain controller attempted to validate the credentials for an account): This event helps track both successful and failed attempts at credential validation by the domain controller. Multiple failures could suggest a brute-force attack. Event ID 5001 (Antivirus real-time protection configuration has changed): This event indicates that the real-time protection settings of Defender have been modified. Unauthorized changes could indicate an attempt to disable or undermine the functionality of Defender. Event ID 5140 (A network share object was accessed): This event is logged whenever a network share is accessed. This can be critical in identifying unauthorized access to network shares. Event ID 5142 (A network share object was added): This event signifies the creation of a new network share. Unauthorized network shares could be used to exfiltrate data or spread malware across a network. Event ID 5145 (A network share object was checked to see whether client can be granted desired access): This event indicates that someone attempted to access a network share. Frequent checks of this sort might indicate a user or a malware trying to map out the network shares for future exploits. Event ID 5157 (The Windows Filtering Platform has blocked a connection): This is logged when the Windows Filtering Platform blocks a connection attempt. This can be helpful for identifying malicious traffic on your network. Event ID 7045 (A service was installed in the system): A sudden appearance of unknown services might suggest malware installation, as many types of malware install themselves as services. Event ID 1102 (The audit log was cleared): This event suggests that someone is trying to hide their activity, as clearing the audit log is often associated with attempts to remove traces of a breach.
Network
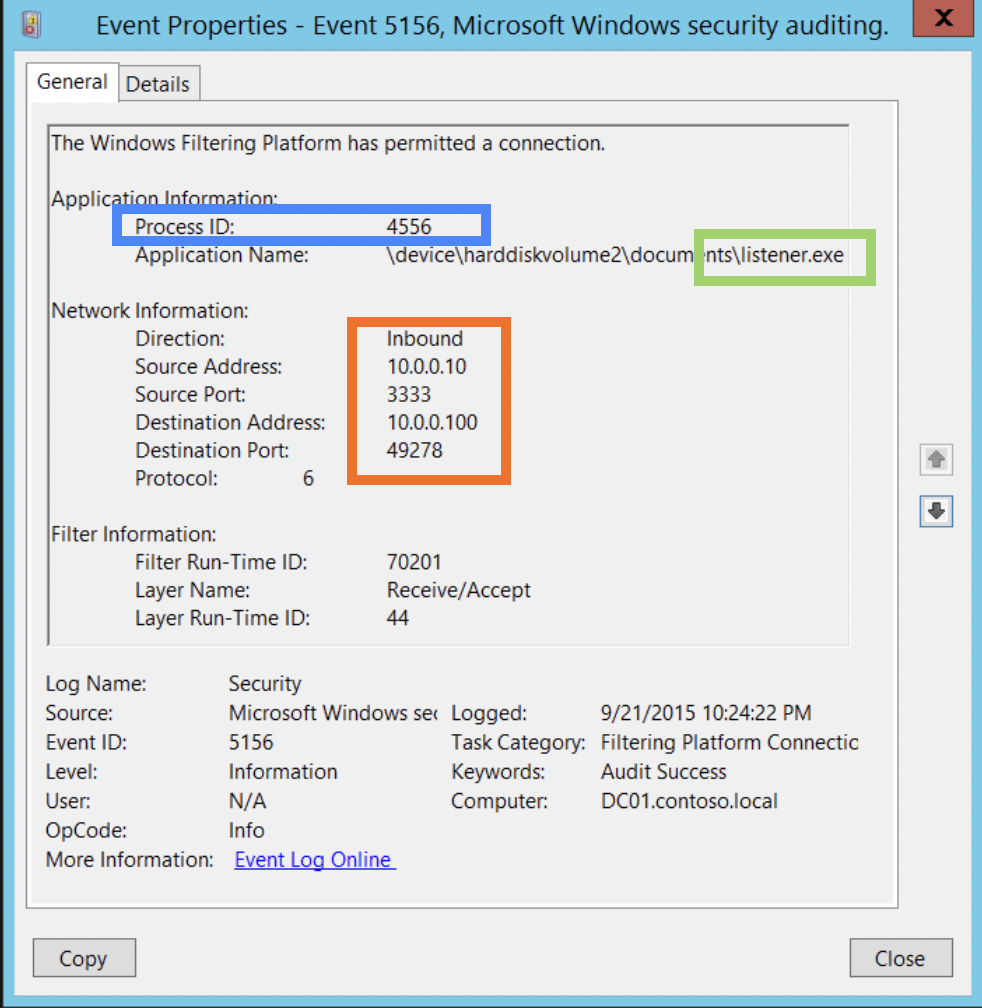
Check for 👣 Windows Security Event Log 5156 is triggered when a network connection is allowed. 4688 - new process starting. 5158 -> 5031 binding started and terminated by fw.
Filter out internal addresses (they are not interesting initially). Check the remote connections. Check executables that launched these connections, also look for port-services mismatch or unusual ports or services. ☝️ malware section as well.
5158 5154 ->
5158 -> 5031 binding started and terminated by firewall.
PID, Application field (path to the executable and exe name), Inbound/Outbound, sport/dport, addresses (src and dst), protocol field.
Windows Security Event Log 5156 is triggered when a network connection is allowed. 4688 - new process starting.
 write-EventLog -eventID 5156 -EntryType FailureAudit -message "hello"
 >Log Application
 >Source Application

 auditpol /set /subcategory:”Filtering Platform Connection” /success:disable /failure:enable
External IPs reputations. 🛠 hostintel. For running the tool, you’ll also need to create a file with a list of IPs. I’ve created a file i.txt in the hostintel directory and so my command was:
python hostintel.py config.conf i.txt
Filter the record to indentify external IP addresses with which the PC is commincating. Then check external IPs reputations for suspicious using, for example, hostintel.
To use hostintel, install it following the instructions on GitHub. Then install geoip2 using pip install "geoip2==3.0.0" . I got an error that geoip.database was not installed when I installed it with pip install geoip2 or from GitHub. This module is for working with GeoIP databases.
To actually use these databases (one is included with the tool, but it mught get outdated), signup here and download GeoLite2 City from here. This is an archive, unpack it and put the *.mmb file in hostintel/data folder (replace). These dbs are used by other tools as well, so you might want to keep it elsewhere and change its path in config.
Also, about the config. Edit this config - hostintel/sampleconfig.conf. By default, only GeoLite2 City is used, but you can add your free public API keys from different threat intelligence resources like VirusTotal, Censys, OTX, Passive Total or/and Shodan. You should rename it more appropriately, like config.conf or aliens-are-among-us.conf 👽. But remember the name of the config, whatever it is, to run the tool.
Frequency Analysis. How frequently is the host connecting to another machine? For how long? Maybe it is something legitimate. But if it’s recent or/and not regular - it could be an indicator.
Unusual. Unusual application names, paths, typos or poker hand ports (44488 12345 or like). Or may some gibberish names. Unusual protocols - 1 (ICMP) 6 (TCP) 70 (UDP). Look for the ports outside of these three.
Use the Microsoft website for more info on specific events - 📚 https://learn.microsoft.com/en-us/windows/security/threat-protection/auditing/event-4624.
4697
Security.
New service installed.
5140
Security.
Mount shares.
5141 - 5145
Security.
SMB shares
System
7045
Service installed. Logged by default. Services started with user credentials are suspicious.
104
System. Logs what logs were cleared 🥶. Logs their SID.
6416
USB
20001
20002
Anti-Forensics
1102
Security. Logs what user cleared the logs.
Exercise
I’ve set up my lab as vaguely described here. Then, I’ve logged into the user sherlock account. Now, I want to see this even in the Event Viewer. Most probably, it’s the Security of System logs. I have wrong time settings on the both machines, but I don’t think it’s a problem for now. I’ve noticed some Logon of type 3 in the logs, but the user is not specified. I don’t quite remember, which id the network logon type has. I think it’s 4… .
No, logon type 3 is the network logon. Weird. It happens very often.
Since there is no SID shown, I suspect that might be a system acc.
Sorting took some time, and I have noticed that Logon events have these IDs: 4624, 4634, 4625, 4648. Now I am going to filter by these IDs and revert to sorting by date and time. Nothing was found. I’ve cleared IDs, leaving just the user name. The filter returned no results as well.
However, I’ve also noticed, that even though no username was specified (N/A), the PC name was mentioned: SHERLOCKPC$. Using this to filter the logs, resulted in null results. Tried SHERLOCKPC as well - nothing.
Some packet was blocked.
Clear log. Then try logging in several times with the wrong password. Then log in with the correct one. Observe the logs. Well, seems like Logon and Logoff events are not initiated by the user. So, the login attempts are actually Kerberos Authentication Service. Now it makes more sense. Let’s filter by this event (4768 - success and 4771 - failure). After successful authentication, we have Kerberos Service Ticket Operations (4769). And now I have it!
I’ve now triggered several authentication failures and one authentication success. And there it is. I have 2 events 4771 (failures) then one event 4768 (success) followed by three events 4769. Why three?
Every minute 4624 and 4634 events are created, meaning new session creating. It seems so that every time I do something in my user account, the events 4624 and 4634 emerge in the logs. Or just every minute.
Let’s go to the user PC (sherlock) and see his logs. It says that access was denied (either the query is too long or the daemon is not running). Of course, the first thing to do was to check whether the service is really running, but it was. So, the problem was something else. Query too long? Don’t think so, since I have not created any views so far. I tried to clear the logs, but failed. May be it’s because the DC is shutdown, or because the user doesn’t have the rights to do so. The only way to check that is to turn on the DC.
Can’t find the event id that is associated with this activity. I Thought 5152 was, but then I saw it appeared on its own.
However System logs had one interesting entry. But failing again has not triggered it.